Bron: artikel gedeeltelijk overgenomen van blog.devops.dev
Origineel auteur: Mike Vizard

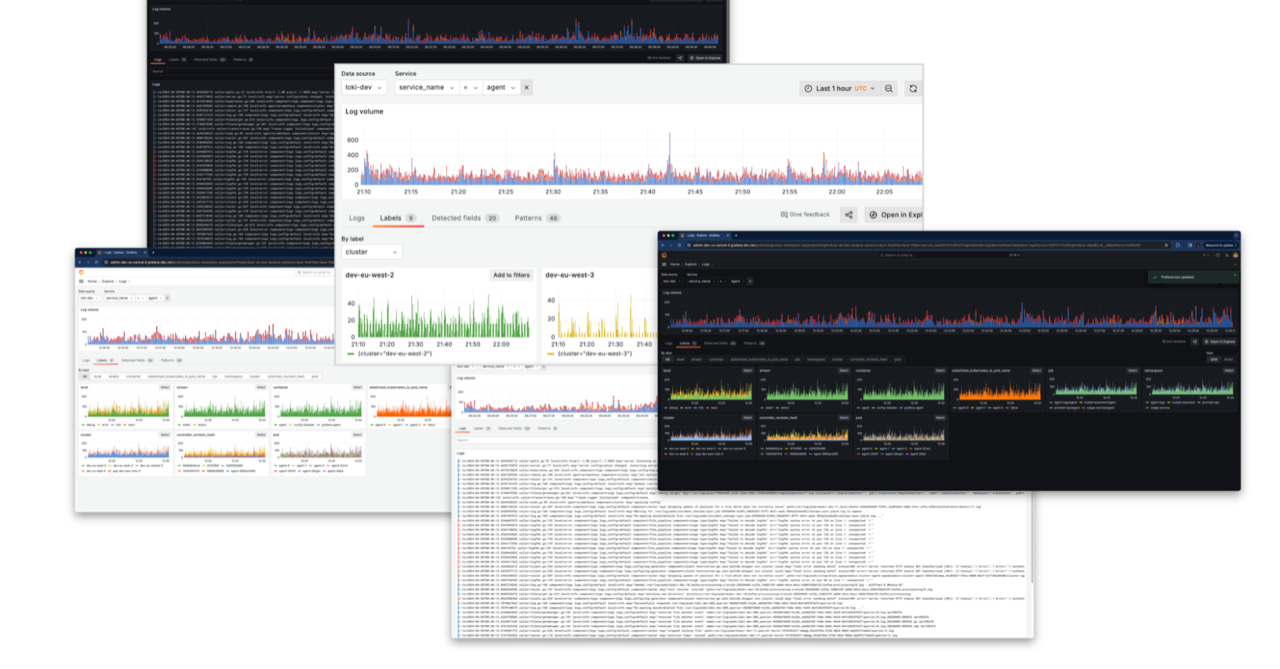
At a GrafanaCon event today, Grafana Labs unveiled an update to its core Grafana visualization platform. The company is offering an Explore Metric module which it says can identify an issue’s root cause — and to do so without anyone having to launch a query against the open source Prometheus platform that is at the core of the Grafana Cloud observability platform.
That’s not the only enhancement. Version 11 of Grafana also makes it easier to edit and share dashboards, in addition to streamlining the number of alerts that a single incident might generate. In addition, Grafana Labs is now making available a curated edition of the OpenTelemetry software dubbed Grafana Alloy that it will extend and support alongside the rest of its open source software portfolio.
Finally, the company is updating Loki log management to make it simpler to streamline the storage of log data.
Grafana Labs CTO Thomas Wilkie said that collectively these updates will make it easier for a wider range of IT professionals, including application developers, to invoke the capabilities of a Grafana Cloud platform based on open source software.
As IT environments become more complex, the need for observability platforms becomes more pronounced. IT teams typically have access to a raft of monitoring tools for tracking pre-defined metrics but their ability to launch queries to surface the root cause of an issue has been limited. As observability platforms continue to evolve, the line between observability and monitoring continues to blur, said Wilkie.
Less clear is to what degree observability platforms might enable IT teams to rationalize existing monitoring tools. In the meantime, the pace at which IT teams are embracing observability varies widely from one organization to another. IT teams need enough expertise to launch relevant queries to get the full return on their investment in an observability platform. In the absence of that expertise, acquiring an observability platform becomes less compelling, in the short term.
In theory, there soon should come a day when machine learning algorithms and other forms of artificial intelligence (AI) make it easier for organizations to identify issues without having to craft queries. But it’s not likely AI will eliminate the need for site reliability engineers (SREs), said Wilkie. Instead, AI will make it simpler to onboard new members to a DevOps team while deploying more applications than ever, he added.
It’s still early days so far as adoption of AI and observability is concerned but there will be an inevitable convergence. The overall goal should be to make it easier to troubleshoot highly distributed application environments that today span cloud, on-premises and edge computing applications. That’s critical because as application environments become more distributed the overall size of most of the IT teams tasked with managing them is not increasing. As such, that pace at which DevOps workflows can be automated will prove crucial.
In the meantime, IT teams should expect it will become more difficult to triage complex IT environments before it hopefully becomes simpler thanks to the rise of observability, automation and AI.
