
Bron: artikel integraal overgenomen van DevOps.com
Origineel auteur: Alan Shimel
Catchpoint’s value proposition is simple to understand. It monitors website and application performance beyond your own infrastructure to provide a “user’s-eye view.”
I have been familiar with Catchpoint for several years, as we covered them here on DevOps.com and other Techstrong sites for some time. On the second day of the #AppDev Tech Field Day in Santa Clara, Catchpoint CEO Mehdi Daoudi presented the Catchpoint story, explaining the difference between garden-variety application performance management (APM) and what Catchpoint does, which it calls Internet Performance Monitoring (IPM).
I couldn’t help but think back to the dot-com days. Several of my friends – Rajat Bhargava, Tom Higley and Neil Robertson – started a company called Service Metrics. Again, the premise was simple: understand how a website was performing from various places throughout the internet.
A funny thing happened with Service Metrics. Less than 18 months after founding the company – even before the product was fully baked – it was bought by Exodus Communications, one of that era’s largest data center providers. In typical dot-com craziness, Exodus stock split several times and went through the roof from when the deal was announced to the time it closed. What was a $280 million dollar acquisition became over a billion dollar deal by the time of closing. Such was life in the dotcom days.
That was over 25 years ago, but the basic premise—monitoring Internet performance�—is similar to Catchpoint’s goals now. Of course, today’s world and network are much more complicated. But ultimately, we all want to know how our websites and applications perform for end users.
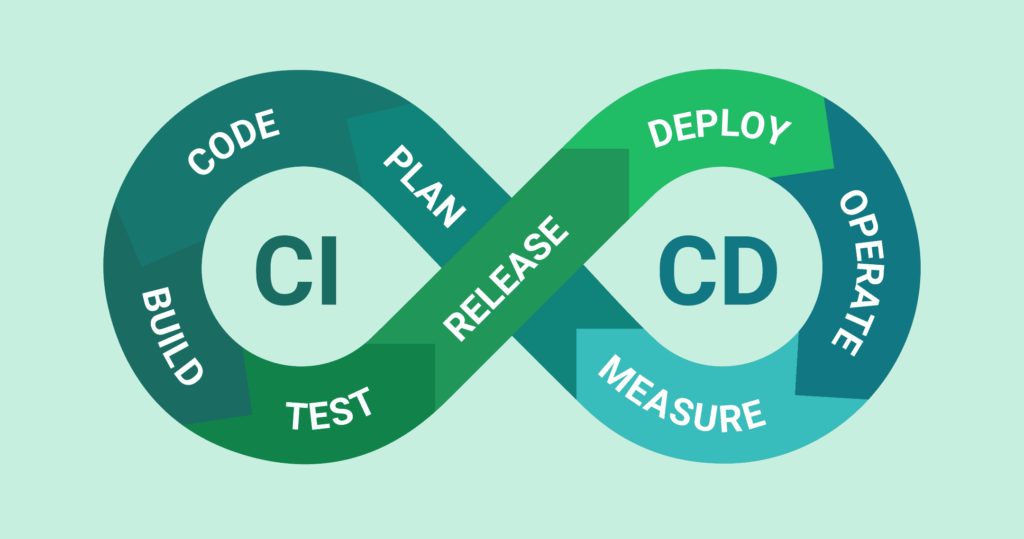
The interesting thing about Catchpoint is that it has matured to the point where the monitoring services can flow directly to the CI/CD pipeline via feedback loops. Using industry-standard tools such as Open Telemetry, Catchpoint works with tools, too. These integrations and standards-based engineering allow Catchpoint to play nicely with the rest of an organization’s tools, help with service-level objectives (SLOs) and take advantage of existing IT investments.
What really excited me, though, was Mehdi’s response to my question about adding automated responses to what Catchpoint monitors. AI can really be a game changer. The company has something like 15 years’ worth of monitoring data, which would be a mother lode for training an AI so it could add actionable, automated responses to what Catchpoint sees as issues.
Daoudi foresees a future where an SRE can wake up, check a Catchpoint “sonar” dashboard, and receive a full report of what Catchpoint saw as sub-optimal performance and what steps were taken to remediate them. And of course, in this scenario, the fixes and findings were incorporated into the next version of the code and tests to check it prior to deployment were already prepared.
Utopian? Maybe. But that is the kind of stuff that every network person I know could only dream of back in the Service Metrics day.
By the way, I loved my first experience as a Tech Field Day delegate, and I’m looking forward to the next one. Perhaps it’ll be in November, in Salt Lake City, around the Kubecon North America conference.